sabinaNSDM

Contents

Overview

The sabinaNSDM R package generates spatially-nested hierarchical species distribution models (NSDMs) that integrates species distribution models (SDMs) at various spatial scales to address niche truncation and produce more reliable predictions than traditional non-hierarchical SDMs. sabinaNSDM combines two SDMs calibrated with species occurrences and environmental covariates at global and regional scales. The global-scale model allows capturing extensive ecological niches, while the regional-scale model features high-resolution drivers of species distributions. This toolkit is designed to facilitate the implementation of NSDMs for ecologists, conservationists, and researchers aiming to produce more reliable species distribution predictions.

sabinaNSDM streamlines the data preparation, calibration, integration, and projection of models across two scales. It automates (if necessary) the generation of background points, spatial thinning of species occurrences and absences (if available), covariate selection, single-scale modelling (global and regional), and the generation of NSDMs using two approaches (“covariate” and “multiply”). sabinaNSDM models use an ensemble modelling approach that combines multiple statistical techniques with the biomod2 package, and covariate selection of the covsel package.

More information on GitHub or in the following article published in Methods in Ecology and Evolution.

Introduction to sabinaNSDM

Introduction to sabinaNSDM: A new R package to improve species distribution models based on spatially nested hierarchical models

Teresa Goicolea, Alejandra Zarzo

Species Distribution Models (SDMs) are essential tools for scientists and conservationists to predict where species are likely to be found, where they have existed in the past, and where they may appear in the future. With pressing issues like climate change and biodiversity loss, generating accurate predictions is more important than ever to identify key areas for conservation actions. However, SDMs often face accuracy issues, especially due to niche truncation and environmental extrapolation problems.

This is where the new R package sabinaNSDM comes in. Designed by our research team SABINA, this package uses a new approach to building SDMs, known as spatially nested hierarchical models (N-SDMs). By combining large-scale global patterns with finer regional features, sabinaNSDM allows for more accurate predictions of species distributions. This makes the new package a powerful resource for conservation planning and ecological research.

The problem with traditional SDMs

Standard SDMs present a set of limitations. Most models fall into one of two categories: regional or global.

  • Regional models focus on specific areas, such as a country or a region. While they can offer detailed information about local conditions, they lack the broader environmental perspective that shapes a species’ distribution. This leads to what is known as niche truncation, where models do not consider the full range of conditions a species experiences across its distribution (i.e., its ecological niche). These spatially restricted models also suffer from a higher proportion of non-analogous conditions, leading to issues when projecting to other areas (e.g., predicting the spread of invasive species) or time periods (e.g., forecasting the impact of climate change on species distribution).
  • On the other hand, global models cover an entire species’ range but often rely on coarse and low-resolution data. They also typically rely only on bioclimatic variables, as other environmental factors are unavailable at such a large scale, and the species data are often imprecise. As a result, they lack the fine details needed for accurate localized predictions.

The solution: Nested Species Distribution Models (N-SDMs)

Spatially nested hierarchical SDMs (N-SDMs) address these issues by combining the broad perspective of global models with the fine detail of regional models to get the best of both worlds. Global models provide an overview, capturing a species’ full ecological niche across its range, and take into account factors like climate at a coarse resolution. Regional models then focus on finer details, such as land use or microhabitat conditions, and more precise species distribution data, which are usually available for smaller areas, such as at the national level. These fine details are critical for making accurate and high-resolution predictions.

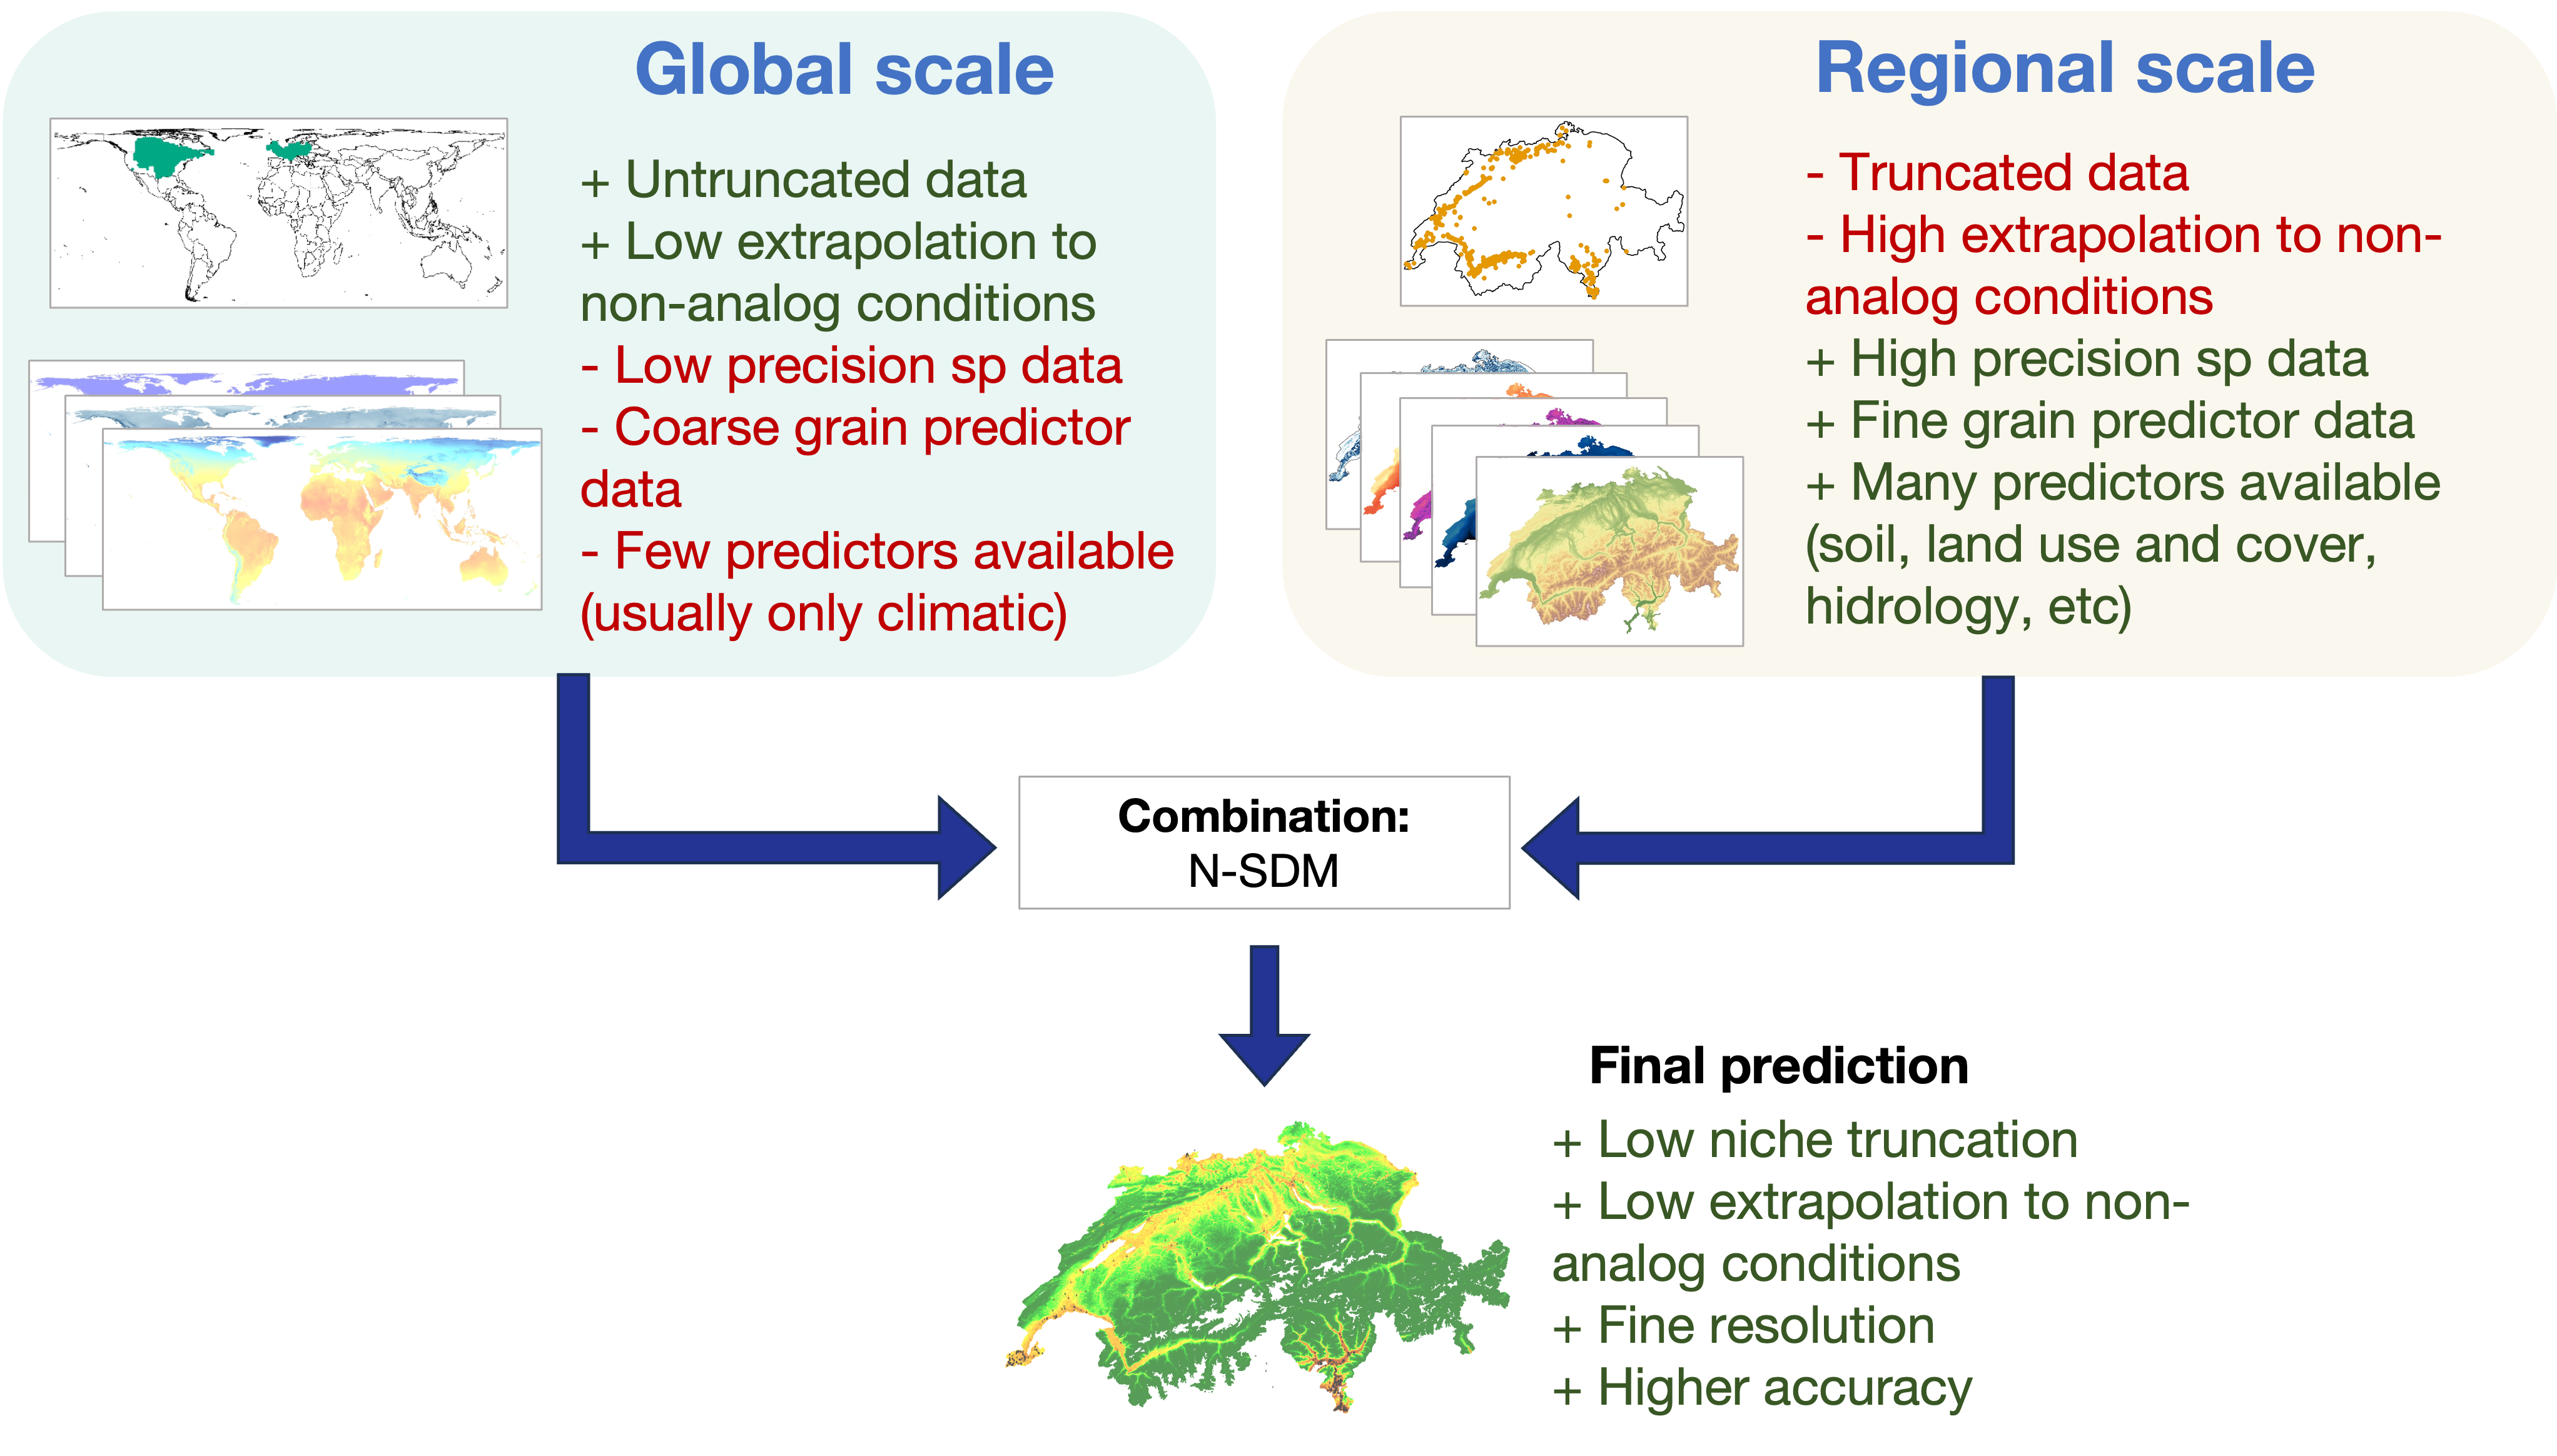
Figure. Advantages (in green) and limitations (in red) of traditional species distribution models (both global and regional scales), compared to the benefits of combining them into a Spatially Nested Species Distribution Model (N-SDM).

Key features of the sabinaNSDM package

sabinaNSDM is designed to make the N-SDM approach more accessible to researchers and conservationists. Here are some of its key features:

  1. Generate N-SDMs: The package combines global and regional models.
  2. Different nesting strategies: Users can choose between two methods for combining models: the covariate approach, which uses the output of the global model as input for the regional model, or the multiple approach, which averages the global and regional predictions.
  3. Consensus models: sabinaNSDM uses consensus models, a technique that combines multiple statistical algorithms to increase prediction reliability and accuracy.
  4. Comprehensive workflow: The package is a tool that integrates (a) background data generation; (b) preparation and spatial filtering of species occurrences (and absences, if available); (c) environmental covariate selection; and (d) N-SDM calibration, evaluation, and projection.
  5. Proven effectiveness: In an applied study on 77 tree and shrub species in the Iberian Peninsula, sabinaNSDM outperformed traditional SDMs, providing more accurate predictions of these species’ distributions.
  6. Open-source and user-friendly: sabinaNSDM is freely available on GitHub, and we are working to make it available on CRAN. The package is designed to be user-friendly, making it accessible to ecologists and conservationists with varying levels of programming experience.

Real-world impact
The ability to accurately model species distributions has real-world consequences, and the improved modeling capabilities of sabinaNSDM can play a crucial role in guiding conservation efforts more effectively. For example, the package can predict how climate change may alter species distributions, guide restoration programs to identify areas with the greatest potential to protect biodiversity, or anticipate the spread of invasive species. One of our key applications has been creating a geoportal that shows the predicted distribution of 200 woody plant species in Spain under current conditions and four future climate scenarios. The geoportal offers practical applications, such as generating lists of shrubs and trees with the highest suitability for specific locations. This can help inform restoration efforts by identifying species most likely to thrive both now and in the future. sabinaNSDM has already demonstrated its potential in our work, and we are excited to see how other researchers and conservationists use it in their projects.

Start using sabinaNSDM

If you are interested in trying sabinaNSDM, you can download the package and explore its features in our GitHub repository. For a deeper dive into how it works, check out our article published in Methods in Ecology and Evolution. We have also included supplementary material and tutorials to help you get started with single or multi-species models. If you are interested in learning more about sabinaNSDM or have any questions, feel free to get in touch.

News

5

Version 1.1.0

This update includes key improvements that make the workflow more flexible, faster, and easier to use, including:

  • Spatial cross-validation: New spatialCV argument to perform spatial cross-validation accounting for the spatial correlation of the data. This helps reduce the risk of overestimating model performance when observations are spatially autocorrelated.
  • Single-scale modeling: It is now possible to run a complete workflow for a single-level (non-nested) model. Just provide data in the regional argument of NSDM.InputData (leaving the global part as NULL) and follow the usual workflow [NSDM.InputData() -> NSDM.FormattingData() -> NSDM.SelectCovariates() -> NSDM.Regional()]. This makes the process faster and simpler when a nested design is not required.
  • Optimized thinning: The process of thinning occurrences and absences has been optimized within the package, removing external dependencies and improving speed.
  • Uncertainty maps in ensembles: A new output layer (EMcv.tif) has been added, which shows the coefficient of variation (sd/mean) among ensemble models. This clearly identifies areas with greater consensus and those with higher disagreement in predictions.

Version 1.0.0

First public release of sabinaNSDM, presented in Methods in Ecology and Evolution. Includes the complete workflow for nested hierarchical modeling:

  • Data preparation and formatting.
  • Selection of environmental covariates.
  • Model fitting at global and regional scales.
  • Hierarchical strategies to combine scales: Covariate and Multiply.

Citing sabinaNSDM package

Mateo, R. G., Morales-Barbero, J., Zarzo-Arias, A., Lima, H., Gómez-Rubio, V., & Goicolea, T. (2024). sabinaNSDM: An R package for spatially nested hierarchical species distribution modelling. Methods in Ecology and Evolution, 15, 1796–1803. https://doi.org/10.1111/2041-210X.14417 DOI

Instalation

library(remotes)
remotes::install_github("geoSABINA/sabinaNSDM")

Tutorials

Examples

Frequently asked questions (FAQ)

  1. How do I install sabinaNSDM?
  2. How should I cite sabinaNSDM?
  3. How can I run a single-level (non-nested) model? Provide your data only in the regional argument of NSDM.InputData() (set the global input as NULL). Then follow the standard workflow: NSDM.InputData(regional = my_data) %>% NSDM.FormattingData() %>% NSDM.SelectCovariates() %>% NSDM.Regional()
  4. How do I run models in parallel for multiple species?
  5. Is there a minimum number of species occurrences required? No, it depends on the user. However, at least 15 occurrences are strongly recommended to ensure more robust and stable model fitting.
  6. What is the format of input data? Species occurrences should be provided as a data.frame with exactly two columns: x and y, representing the species presence coordinates. Do not include row names. The coordinate projection must match that of the environmental covariates.Environmental variables for each spatial scale (i.e., global and regional) should be provided as SpatRaster objects, with each band corresponding to a different covariate. The regional-scale SpatRaster must include all covariates present in the global-scale file, and may additionally include covariates that are only available at the regional level. Additionally, a regional-scale SpatRaster or a list of SpatRaster objects corresponding to the covariates used to project the models under one or more alternative scenarios (e.g., future climate projections) can be provided.
  7. How are background points generated? By default, background points are automatically created by the package if not provided in NSDM.InputData(). In this case, the NSDM.FormattingData() function generates 10,000 background points per scale (default, user-customizable), which can be randomly distributed (default) or stratified. Random method: background points are generated by selecting random cells from the environmental rasters at each scale and extracting their coordinates. Stratified method: based on a PCA of all environmental covariates. The first two principal components are divided into quartiles and combined to create 16 strata. Background points are then sampled randomly within each stratum in proportion to its area, using the sgsR R package (Goodbody et al., 2023).
  8. How do I generate uncertainty maps for ensemble models? rom version 1.1.0 onward, an additional raster layer EMcv.tif is produced automatically, showing the coefficient of variation (standard deviation / mean) across ensemble models. This allows users to easily identify areas of high consensus and areas with greater disagreement among models.
  9. What statistical algorithms are used? sabinaNSDM supports an ensemble approach using multiple algorithms. Currently implemented methods include: GAM (Generalized Additive Models) GBM (Generalized Boosted Models) GLM (Generalized Linear Models) MARS (Multivariate Adaptive Regression Splines) MAXNET (Maximum Entropy models) RF (Random Forests)
  10. What types of validation are used? By default, k-fold cross-validation is implemented, where the number of folds is user-defined. From version 1.1.0 onward, the package also supports block spatial cross-validation, where both the number of folds and block size are user-defined. This method accounts for spatial autocorrelation and provides more reliable model evaluation in spatially structured datasets.